By Dr. Anna Zhenchuk, published on 3rd June 2016 (updated July 2025)
When it comes to testing fortified foods, biological samples, or any analyte of public health relevance, the numbers we report carry weight. A single test result might be used to pass or reject a product, influence a policy, or decide on a program’s success. But behind every number lies a simple truth: no measurement is perfect.
That’s why understanding measurement uncertainty is so important. Rather than undermining our results, it provides a clearer picture of their reliability and helps us make more informed decisions.
In recent years, while working in the field of micronutrient measurement in food and biological samples, I’ve often been asked: “How reliable is a measurement result?” or “How accurate is the method used to get the result?”
According to the literature and international guidelines, various approaches to answering these questions can be found, some of which are conflicting. In this blog article, I aim to share a personal and practical summary of what is perhaps the most widely accepted and informative way to express the reliability of a measurement: measurement uncertainty.
Why Uncertainty Matters in Fortification
In food fortification programs, regulatory decisions often rely on a single laboratory test result. Without a clear understanding of the uncertainty associated with that result, there is a risk of making incorrect decisions, such as rejecting a compliant batch or approving one that does not meet the required standards.
Consider the following example: a sample of fortified wheat flour is tested for its iron content. Regulatory specifications require a minimum level of 30 ppm* (1). The test result indicates 25 ppm. Should the batch be rejected?
Analytical methods are subject to variability, and each test result has an associated level of uncertainty. In this case, the test method has a known measurement uncertainty of 20%. This means the true value could lie anywhere between 25ppm ±20%. 20% of 25 ppm is 5 ppm; this produces the range 20-30 ppm, which overlaps with the target level of 30 ppm, and the sample can be accepted (2, 5).
From the example above, the value of ±20% represents a 95% confidence that the actual iron content falls 20-30 ppm range (5).
This illustrates the importance of reporting measurement uncertainty alongside test results. Without it, acceptance or rejection decisions may become arbitrary and lack scientific justification.
Measurement uncertainty is a critical component of quality assurance and regulatory enforcement. It enables transparent, evidence-based decisions that are aligned with international best practices. As outlined in ISO/IEC Guide 98-3:2008 (reviewed and confirmed in 2023), all measurement results should be reported together with their associated uncertainty (2).
No result is perfect
Let’s start with a simple truth: no measurement is perfect. Every result comes with some level of imperfection, no matter how carefully the measurement is performed.
Measurement uncertainty is the term used to quantify this imperfection. What causes uncertainty? Several factors, such as (5, 6):
- Sampling methods
- Sample preparation
- Equipment calibration
- Environmental conditions
- Operator’s technique
In simpler terms, measurement uncertainty includes:
- The possibility of measuring unintended substances or missing some of the target analytes.
- Variation between repeated measurements of the same sample.
- Differences between a sample and the portion analyzed.
By understanding these factors, we can better evaluate the reliability of any result (4).
How is measurement uncertainty calculated?
Measurement uncertainty is typically evaluated during the validation of a method, whether in the lab or for portable field methods.
There are detailed guidelines and protocols provided by both The Association of Official Analytical Chemists (AOAC) INTERNATIONAL as well as International Organization for Standardization (ISO) on how to evaluate the measurement uncertainty (2, 7). Validation involves testing a sample with a known concentration of the analyte under various conditions. This helps determine two key components:
- Bias: The systematic error, or the difference between the average of measured values and the true value.
- Precision: The random error, or the variability in repeated measurements, expressed as a standard deviation (SD) (5).

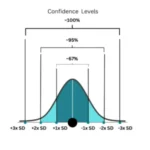
Figure 1: Confidence interval and its relationship with standard deviation
To calculate uncertainty:
Add the bias and 2x the relative standard deviation (±2xSD) to create a range. This range gives a 95% confidence level, meaning there’s a 95% chance that the true value falls within it (2, 5).
Example: If the bias is 1% and the SD is 5%, the uncertainty is: 1% + (2×5%) = ±11%.
When we measure something, measurement uncertainty reflects the range around the result where the true value is likely to lie. This range often corresponds to a certain level of confidence: for example, a 95% confidence level typically spans ±2 SD, meaning we are 95% sure the true value falls within this range. (Figure 1)
Similarly, at ±1 standard deviation, the confidence is about 66%, and at ±3 SD, it’s >99%, showing how uncertainty is directly linked to both the spread of measurements and our confidence in the result.
Applying Uncertainty to Real-World Testing
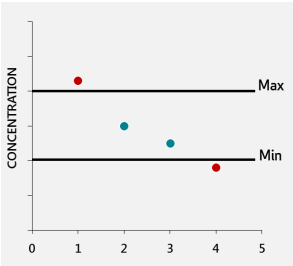
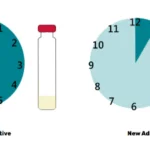
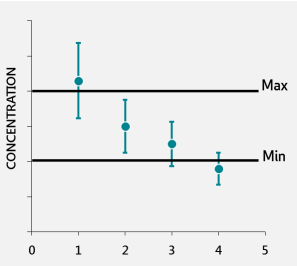
Imagine you test four batches of fortified food. Results are compared to tolerance limits, which define the minimum and maximum acceptable nutrient levels. If you report results as single values, two out of four might fall outside the tolerance limits, as seen in Figure 2.
When the uncertainty is included, the same results might all fall within the acceptable range. Reporting the uncertainty provides confidence that these results are valid, preventing unnecessary rejection of good batches, see Figure 3 (1) (4).
Knowing and understanding measurement uncertainty allows:
- Comparison of results from different labs or devices.
- Confident decision-making in quality control and regulatory assessments.
- Improved reliability of results.
From Measurement to Meaning
Measurement uncertainty is not just a technical detail; it is essential to accurate, fair, and credible decision-making. Whether you’re a food producer, a program implementer, or a regulatory body, acknowledging that no result is perfect helps ensure that evaluations are both rigorous and realistic.
When methods are properly validated and uncertainty is clearly understood, test results become far more meaningful. And when someone asks how reliable a result is, your answer won’t just be a number but a scientifically supported range. Here are a few key takeaways:
- No result is perfect: Every measurement has some degree of uncertainty.
- Every method should be validated: Understanding bias and precision is key to ensuring accuracy.
- Knowing your uncertainty leads to confidence: It helps make informed and fair decisions.
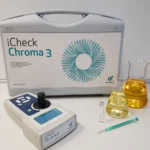
From Lab Precision to Field Efficiency
Whether you’re conducting quality control or ensuring compliance with nutritional standards, BioAnalyt’s iCheck tools offer dependable solutions. Each tool is backed by validation and detailed performance guides. For product support, and training, or to place an order, contact us at support@bioanalyt.com
Together, let’s ensure your measurements are reliable and impactful.
*Parts per million (ppm) is a standard unit used to express trace concentrations of substances in food matrices (3).
References
- WHO. WHO guideline: fortification of maize flour and corn meal with vitamins and minerals. Geneva (Switzerland): WHO; 2016.
- Uncertainty of measurement — Part 3: Guide to the expression of uncertainty in measurement (GUM:1995). ISO/IEC Guide 98-3:2008(en). Available from www.iso.org. Reviewed and confirmed in 2023
- Bell S. A Beginner’s Guide to Uncertainty of Measurement. Measurement Good Practice Guide No. 11 (Issue 2). National Physical Laboratory, UK, 2001.
- De Bièvre, P. and Günzler, H. Measurement Uncertainty in Chemical Analysis. Paul Springer Science & Business Media, 29 Jun 2013.
- Ellison, S.L.R and Williams, A. Eurachem/CITAC guide: Quantifying Uncertainty in Analytical Measurement, Third edition, (2012) ISBN 978-0-948926-30-3. Available from www.eurachem.org.
- Guidelines for Laboratories Performing Microbiological and Chemical Analyses of Food, Dietary Supplements, and Pharmaceuticals – An Aid to the Interpretation of ISO/IEC 17025:2005. (2015) (ALACC Guidelines). Available from www.aoac.org.
- White, G.H. Basics of Estimating Measurement Uncertainty. Clin Biochem Rev. 2008 Aug; 29 (Suppl.1): S53–S60.
- FAO Guidelines on Measurement Uncertainty, 2021.