By Dr. Anna Zhenchuk, published on 3rd June 2016
In the last few years working in the field of micronutrient measurement in food and biological samples, I often encountered the questions “how reliable is a measurement result?” or “how accurate is the method used to get the result?” Looking to literature and international guidelines, one can find many different and sometimes conflicting approaches to answering these questions. In this technical update I attempted to summarize information on the most common indicator of the measurement reliability, which, paradoxically, is referred to as measurement uncertainty.
To reject or not to reject
According to the International Standards Organization (ISO) any measured result is required to be reported along with the related measurement uncertainty, as opposed to being reported as a single value (Guide to the Expression of Uncertainty in Measurement) (1). However, for most people dealing with the concept of measurement uncertainty still remains daunting. In my experience, this subject is indeed complicated and still widely misunderstood from the factory floor to top academic circles.
Important decisions are often made based on the result of a chemical analysis: passing or rejecting a product (i.e. fortified food) as not meeting specifications during internal quality controls or for regulatory purposes. The accuracy of the result, defined by the measurement uncertainty, must fit the intended purpose: it should not be too low, as that would impact the risk on consumer, and not too high, as that would impact the cost for producer.
No result is perfect
Let us start with the main statement: no measurement result is perfect, however carefully and precisely performed! The term measurement uncertainty is used to describe this lack of perfection.
The factors that influence the measurement uncertainty include, but are not limited to, sampling, sample preparation, the analyte being measured in a sample, measuring equipment, equipment calibration, operator and the environment in which the measurement is performed. This can also be explained in other terms, in that measurement uncertainty includes:
- the possibility that not only the target analyte is measured and/or not all of the analyte is measured with a specific method;
- the variation (spread) between repeated measurements of the same sample;
- the likelihood that the test portion of the sample is not representative for the target analyte (3).
How is measurement uncertainty calculated?
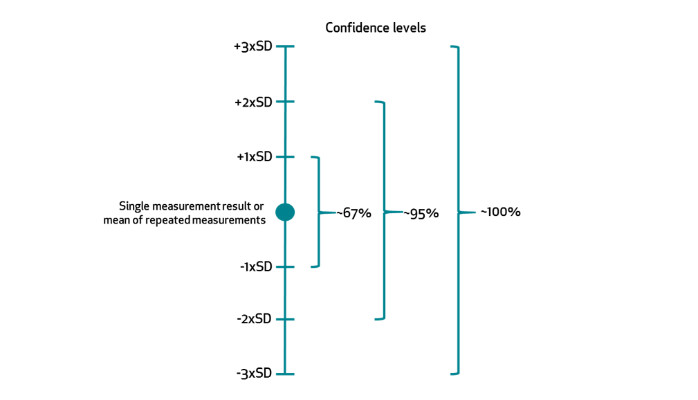
Figure 1
There are detailed guidelines and protocols provided by both the Association of Analytical Chemists (AOAC) as well as ISO on how to evaluate the measurement uncertainty (1, 4, 5). The evaluation is usually performed during the validation of a certain method for a specified analyte and sample type. In a nutshell, a validation comprises repeated measurement of a sample with defined amount of the analyte (true value) under various conditions.
During validation the bias and precision are calculated – two major components of measurement uncertainty (1). The bias represents systematic error: difference between the mean (average) of repeated measurements and the target “true value”. The precision represents random error: the spread of the repeated measurement results expressed as standard deviation (SD).
The measurement uncertainty is calculated by taking the sum of the bias and standard deviation. If the bias in the result of a particular measurement has been defined, then the result can be corrected thus reducing measurement uncertainty. In turn, by summing up more standard deviations you are increasing your confidence that the “true value” is within the range of measured value ± measurement uncertainty (see figure 1). The confidence level states how sure we are that the ‘true value’ is within a certain margin.
So calculation of measurement uncertainty with 95% confidence level looks like this: Bias ± 2xSD.
Uncertainty = Confidence
So how would measurement uncertainty affect decisions that are taken with the single measured results? Let’s take an example of a food fortified with a particular micronutrient and the single results are used to accept or discard a batch. Figure 2 shows results reported without measurement uncertainty only as single measured values. This leads to 2 out 4 values falling outside of tolerance limit, and “failing” although they are very close to the limits. Here tolerance limits define the target minimum and/or maximum accepted amount of the analyte in a specific sample. On the other hand, when the results are reported with measurement uncertainty all four results “pass” (figure 3).
Knowing and understanding the margin of uncertainty for a specific measurement enables comparison of the test results from different sources and empowers more confident and informed decisions. When the result of a measurement is stated with its measurement uncertainty it provides a quantitative indication about the quality of the result and consequently enables assessment of the result reliability.
In summary, when making decisions based on measurement results it is important to keep these key points in mind:
- No result is perfect
- Every method should be validated
- Knowing your uncertainty leads to confidence
We look forward to your feedback and thoughts on what measurement uncertainty means to you!
References
1. Uncertainty of measurement — Part 3: Guide to the expression of uncertainty in measurement (GUM:1995). ISO/IEC Guide 98-3:2008(en). Available from www.iso.org.
2. Bell S. A Beginner’s Guide to Uncertainty of Measurement. Measurement Good Practice Guide No. 11 (Issue 2). National Physical Laboratory, UK, 2001.
3. De Bièvre, P. and Günzler, H. Measurement Uncertainty in Chemical Analysis. Paul Springer Science & Business Media, 29 Jun 2013.
4. Ellison, S.L.R and Williams, A. Eurachem/CITAC guide: Quantifying Uncertainty in Analytical Measurement, Third edition, (2012) ISBN 978-0-948926-30-3. Available from www.eurachem.org.
5. Guidelines for Laboratories Performing Microbiological and Chemical Analyses of Food, Dietary Supplements, and Pharmaceuticals – An Aid to the Interpretation of ISO/IEC 17025:2005. (2015) (ALACC Guidelines). Available from www.aoac.org.
6. White, G.H. Basics of Estimating Measurement Uncertainty. Clin Biochem Rev. 2008 Aug; 29 (Suppl.1): S53–S60.

ABOUT THE AUTHOR
Dr. Anna Zhenchuk is the Managing Director at BioAnalyt, where she has overseen new product development and provided hands-on support to customers in over 30 countries. Her background is in biotechnology, immunology and nutrition as well as business administration.